
Analytics
Understand what guests are really looking for.
See menu views, location activity, dish performance and the filters guests use most, so you can make better menu and publishing decisions with more confidence.
Analytics overview
Menu engagement
Total menu views
826
This period
Edinburgh
Most-viewed location
Summer menu
438 views · leading menu
See the patterns behind every menu visit.
Track menu views over time, compare periods, and see which locations or menus are getting the most attention. Harlo helps you move beyond guessing and understand how your menus are being used.
Keep an eye on shifts as menus, service periods and locations change.
Performance overview
All locations · Last 30 days
Total menu views
A simple view of guest attention over time.
Views by location
Menu views by menu
See which dishes and menus guests come back to.
Understand which dishes get viewed most, which menu sections draw attention, and what guests save or shortlist while deciding. These signals can help shape menu development and spotlight what deserves more attention.
Menu attention
Top viewed dishes
Decision signals
Shortlisted dishes
BBQ chicken wings
3 views · 67% rate
Chilli burger
0 views
Classic burger
4 views · 50% rate
Saved and shortlisted dishes help show where guests are considering a choice more closely.
Learn what guests filter out.
See which allergen filters and dietary preferences guests use most. That gives you a clearer view of what they are looking for, what they are avoiding, and how your menu is being explored.
Spot suitability needs that may need clearer coverage or communication.
Understand what guests are checking before they make a choice.
Guest preferences
Filters used across all locations
Allergen filters
Dietary & suitability
See where guests are viewing from.
Track where menu visitors are coming from, how they are accessing your menus, and how behaviour differs across locations. This helps you understand reach, local interest and how guests interact with your menus across the estate.
Useful for a single restaurant, a growing group or a franchise network.

Where guests are viewing from
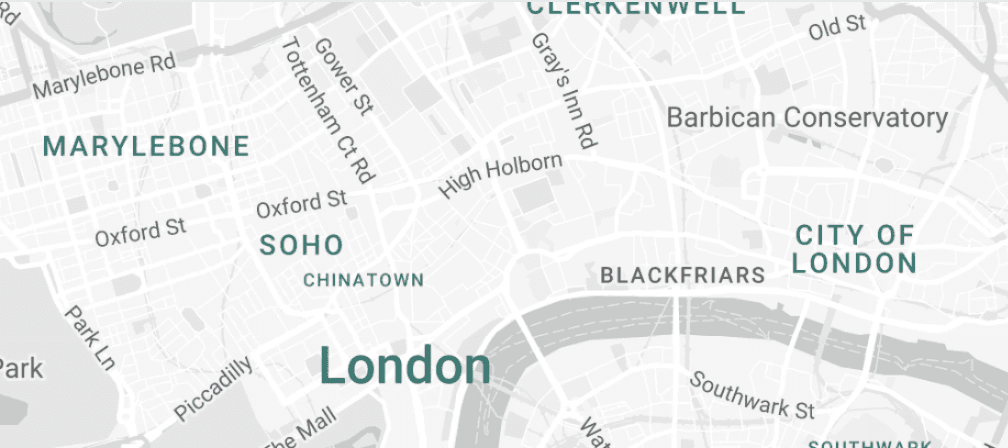 Central London activity
Device mix
826 viewsBetter menu decisions start with better signals.
Guest behaviour tells you more than page views alone. Harlo helps you spot what people are viewing, filtering, saving and returning to, so you can shape menus with more confidence across dishes, locations and service periods.
See which dishes and menus attract the most attention
Understand allergen and dietary behaviour in context
Compare periods and locations to spot shifts over time
Use menu insight to support development, pricing and publishing decisions
Analytics questions, answered.
What can Harlo analytics tell me about my menu?
Harlo brings together menu views, location activity, dish attention and filter use, so you can see how guests are browsing the menus you publish.
Can I compare menu performance across locations?
Yes. Use location and period context to compare where menu attention is landing across your estate.
Can I see which dishes guests view the most?
Yes. Top viewed and shortlisted dish signals make it easier to see which items are attracting attention while guests decide.
Can I understand which allergen filters guests use?
Yes. Harlo shows the allergen filters guests use, helping you understand what they are avoiding as they browse.
Does Harlo show dietary and suitability filter usage?
Yes. Dietary and suitability signals sit alongside allergen behaviour, including preferences such as vegan, halal and gluten-free options.
Can I see where menu visitors are coming from?
Harlo can show location context alongside how guests access your menus, helping you understand local interest across the business.
Can I compare performance over different time periods?
Yes. Period controls let teams look at engagement over time and compare activity as menus, locations or service periods change.
Can analytics help with menu development decisions?
They provide useful behaviour signals for deciding what to develop, clarify, promote or review. They complement the operational knowledge already held by your team.
Can this work for one site as well as a group?
Yes. A single operator can understand one guest menu, while groups and franchise networks can add location context to the same picture.
Do I need advanced technical knowledge to use Harlo analytics?
No. The analytics are presented in practical menu and location terms, so teams can use them without building their own reports.
See what your menus are telling you.
Turn guest browsing behaviour into clearer menu decisions, from your most viewed dishes to the filters guests use every day.